This will be a basis for models that predict the future of your development as a company, especially to do with your consumers’ habits and sales figures. You cannot be a seer to project the future concerning your company’s future because even with a predictive analytics model for your company’s future, there is no significant decision you ever have to come up with haphazardly.
What would be the role of predictive analytics in business processes? Well, you’re going to need machine learning for this. The global predictive analytics market is expected to expand at a compound annual growth rate (CAGR) of 21.7% from USD 10.5 billion in 2021 to USD 28.1 billion by 2026.
From predicting future sales volumes to predicting consumer behavior, machine learning offers a foundation for developing predictive models that can meet any business requirement. In this blog, we’ll explore what is predictive modeling, its types, common predictive challenges, and more.
What is Predictive Modeling?
A subfield of data analysis known as “predictive analytics” uses various techniques, such as artificial neural networks, machine learning algorithms, and statistics, to predict future possible events from past data.
Predictive analytics’ prime purposes are to automatically classify data points; predict potential events using data and predict what would happen, going forward including trends, some sort of behaviors or events, or any such scenario. Put another way, predictive analytics uses all available data to gauge the chances or probability of something happening.
You may have come across other types of analytics, like prescriptive, diagnostic, and descriptive analytics, which are the stages of analytics maturity.
When and Why to Choose Predictive Analytics?
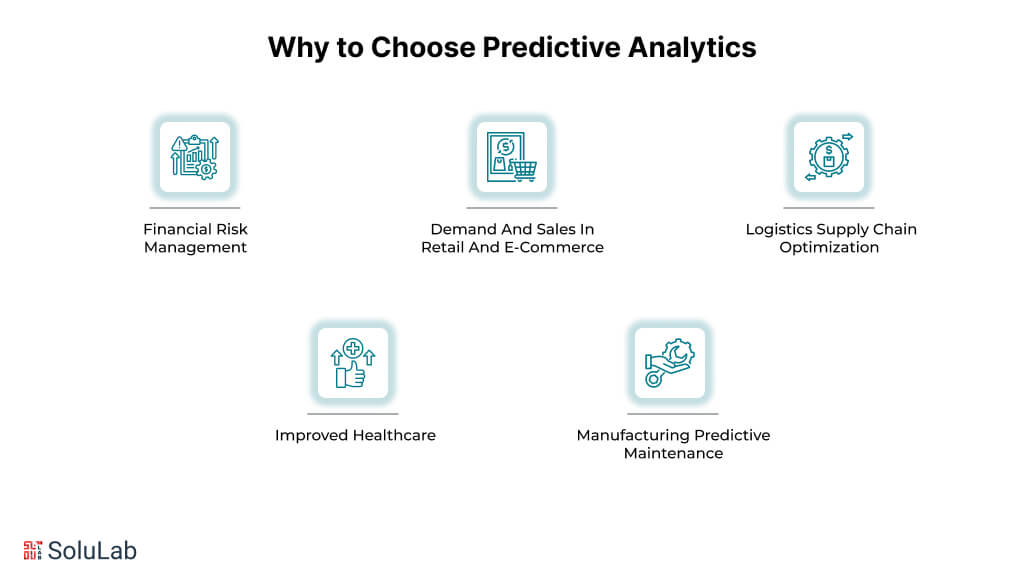
Businesses may look forward and make better decisions based on prior experiences by utilizing predictive analytics. Here are some situations where it can be quite helpful.
1. Financial Risk Management
Predictive analytics is used by organizations to detect possible dangers and take action before they become issues. Predictive models, for instance, can be used in the financial services industry to estimate the probability of AI in risk management or loan defaults.
2. Demand And Sales In Retail And E-Commerce
Insufficient stock and overstock issues cost North American AI agents in Retail and E-commerce about $349 billion in sales in 2022, according to a report by the IHL Group titled “True Cost of Out-of-Stocks and Overstocks – Can Retailers Handle the Truth?”
Predictive analytics can assist merchants in better forecasting demand, optimizing inventory levels, and minimizing both overstock and out-of-stock by examining past sales data, trends, and patterns.
Predictive analytics can also be used by businesses to better analyze consumer behavior, which can guide more focused marketing campaigns in, individualized customer service, and enhanced client retention initiatives.
3. Logistics Supply Chain Optimization
Predictive analytics helps optimize the AI Agents in the supply chain, manage inventory, and predict demand from a logistics perspective. This therefore reduces costs and increases efficiency.
4. Improved Healthcare
Predictive analytics can improve diagnoses, estimate patient outcomes, and customize treatment regimens in the industry. The daily operations of healthcare practitioners are improved in addition to the quality of patient treatment.
5. Manufacturing Predictive Maintenance
Predictive analytics is used in manufacturing and aviation to schedule maintenance and predict when equipment will fail, thus reducing downtime and increasing the life of equipment.
Choosing a predictive analytics approach means you are willing to invest wisely in getting quality data and the people and resources needed to make sense of it. We outline how to do this below.
Types Of Analytics And How Predictive Analytics Is Different
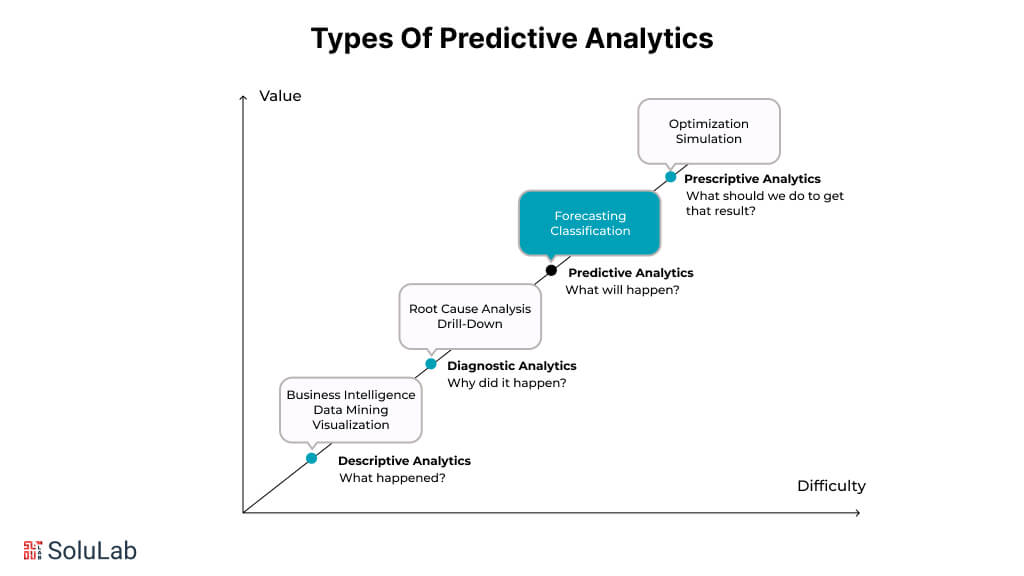
According to their maturity level, there are four primary categories of data analytics.
1. Descriptive Analytics
Through the collection and visualization of historical data, descriptive analytics offers insight into past events. Over time, this kind of analytics aids firms in understanding their current situation. Primarily data analysts.
Tools were employed. Database management systems, business intelligence (BI) platforms, and data visualization programs like Tableau or Power BI. Data mining and aggregation are the main methods used to create reports, dashboards, and visual representations that help identify trends and patterns.
2. Analytics for Diagnosis
To identify patterns and relationships and provide an explanation for an event, diagnostic analytics digs deeper into the data. More advanced data processing is now available to find correlations and underlying causes.
Data scientists and statisticians. Tools were employed in AI agents for Manufacturing. Platforms for advanced analytics that provide sophisticated data processing tools, statistical software like SAS or SPSS, and drill-down capabilities. Comes closer. Techniques like multivariate statistics, drill-down, and correlation analysis sometimes call for the integration of multiple data sources to create a full picture.
3. Analytics for Prediction
As previously said, predictive analytics uses machine learning techniques to evaluate vast amounts of data to estimate what is likely to occur in the future.
Large datasets are handled by data scientists and machine learning engineers who create predictive models. Tools were employed. To manage scalability, use cloud data platforms, data modeling tools, and machine learning frameworks like TensorFlow or Scikit-learn.
To make predictions, this kind of analytics usually uses machine learning algorithms and statistical models. Regression analysis, forecasting, categorization, and other predictive modeling techniques are among the techniques.
4. Prescriptive Analysis
In addition to forecasting future events, prescriptive analytics makes recommendations for activities that may affect those results.
Experts are required. Data scientists and analysts in operations research. Software for simulation and optimization, such as IBM ILOG CPLEX or Gurobi, and systems for decision management. Complex mathematical models and procedures, such as stochastic optimization, simulation, and linear programming, are used in this sort of analytics.
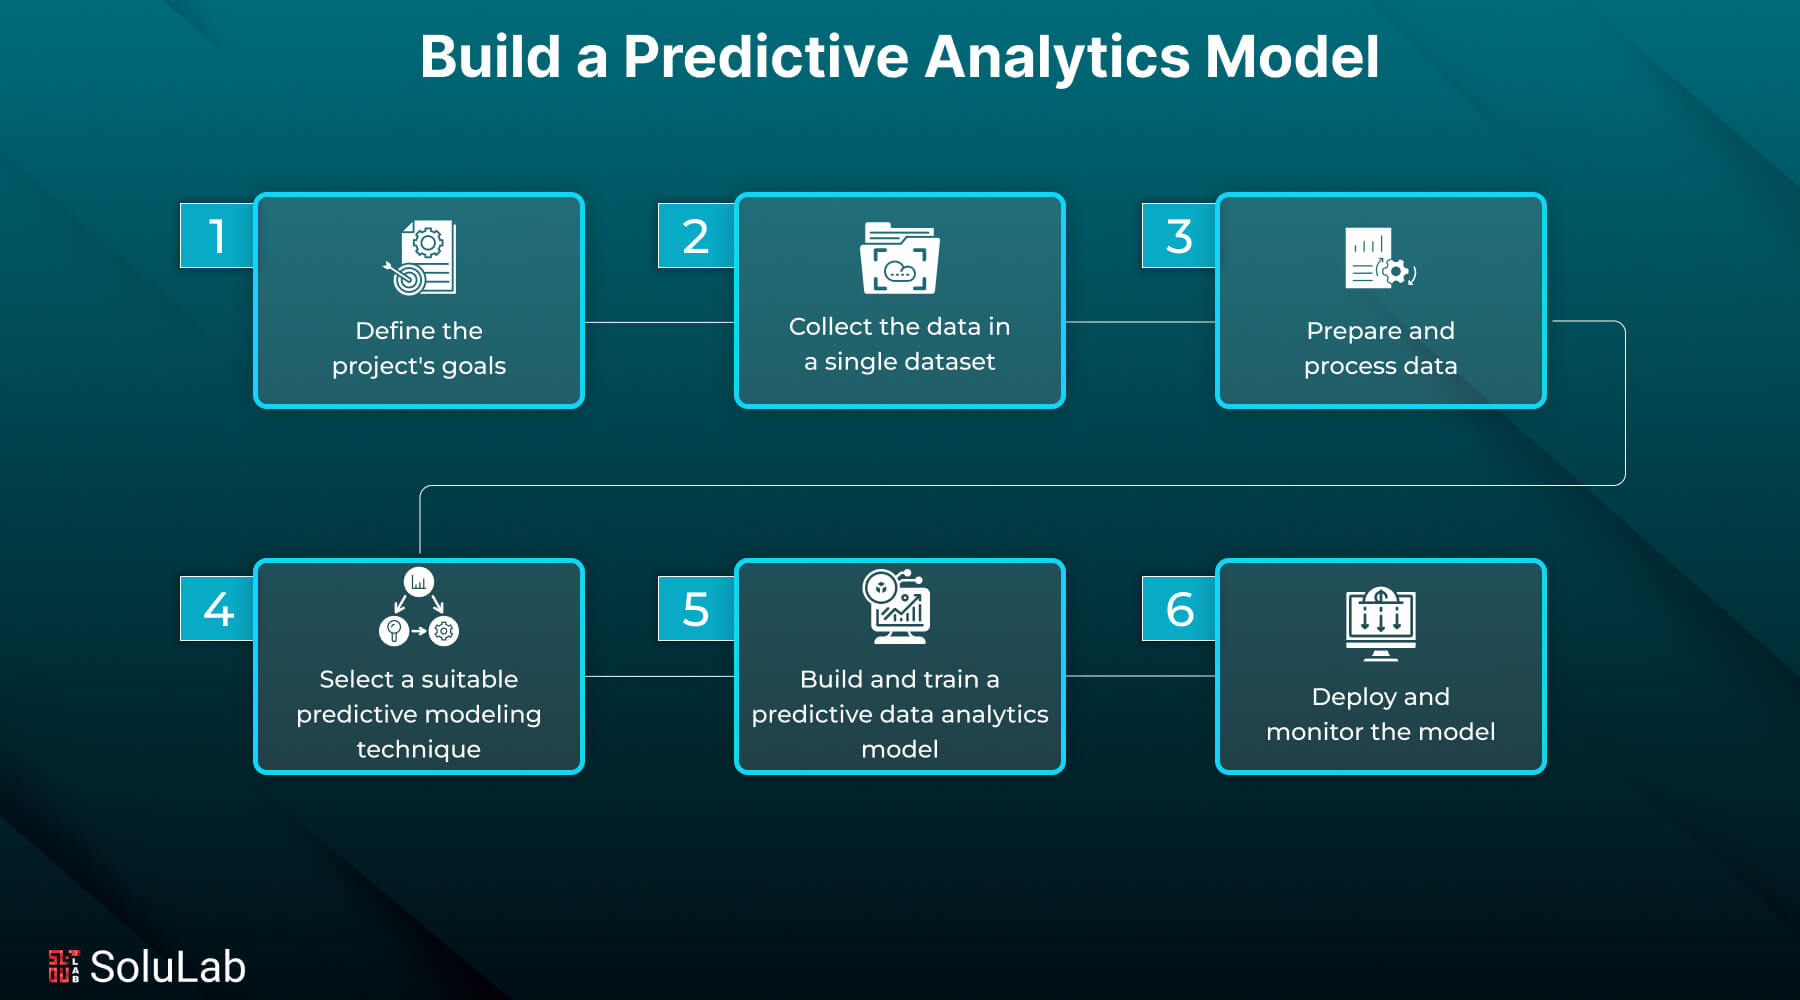
How to Build a Predictive Model?
Here are the key steps to build a predictive analytics model:
A. Define The Project’s Goals
Setting goals is the first step in any software development project. This is the most crucial phase, where you respond to the following queries:
- What have we got?
- What are our options?
- What are we going to produce?
1. Statement of the Problem
Determine the precise issues you wish to address with the predictive analytics model before delving into data or algorithms. Talking with stakeholders to learn about their expectations, problems, and definition of success may be necessary for this.
2. Consensus Regarding The Success Metrics
You establish measurable success metrics after the issues are well-defined. These criteria will direct the development process and aid in gauging the prediction model’s efficacy after it is put into use.
3. Recognizing Requirements And Limitations
Every project has its own set of limitations, which may be time-, money-, or data-specific. The model may also have to comply with technological or legal specifications. When creating predictive models, consider them as soon as you can.
To illustrate the variations in decisions at each level, we’ll use two cases. Assume that a medical facility is looking for a solution that can detect people who are at risk of developing lung cancer. An e-commerce company that wishes to forecast demand and pricing for certain products it sells will be a different scenario.
(i). Example In Healthcare:
Finding patients with a high risk of lung cancer is the aim. Success metrics include patient outcomes, early detection rates, and risk prediction accuracy in AI in healthcare. Limitations and prerequisites: High sensitivity and specificity in model predictions to reduce false negatives and positives, as well as adherence to healthcare standards.
(ii). Example Of E-Commerce:
- Objective: Estimate product demand and choose the best pricing plans. Success indicators include more sales, better inventory control, and higher customer satisfaction thanks to more effective pricing.
- Requirements/constraints: Integration with current e-commerce platforms, capacity to manage big datasets from sales transactions, and flexibility in response to market movements. We can create a predictive model that meets the demands of a certain industry once we are aware of the objectives and specifications. This initial phase establishes a strong basis for the model’s technical advancement.

B. Collect The Data In A Single Dataset
Following the establishment of objectives, data collection for predictive analytics modeling is carried out. There are typically two situations when it comes to data:
Scenario 1: You already have a sufficient amount of internal business data that has been gathered over time.
Scenario 2: You either don’t have any information at all or there isn’t much of it. If so, data must be gathered from outside sources (such as publicly available datasets that are free to use; certain data can be purchased from providers).
In the majority of situations, particularly if your niche is specific, at least some internal data must be accessible because external data could not be adequate or contain the necessary information.
1. Quantity of Data
The question, “How much data do I need for the predictive model to yield a good result?” becomes crucial as a result. In a nutshell, “The more, the better.”
A more thorough response may sound like this: The model will perform better and display a higher score the more it learns intricate patterns and dependencies.
Predictive analytics usually uses traditional machine learning tasks using tabular data, therefore even a little dataset, such as 20 rows of data with 5 features, is probably insufficient. Simply said, the model will overfit these 20 examples, making inaccurate predictions when it encounters additional information beyond what it has learned.
Now, let’s return to our examples.
Example in Healthcare: It would be insufficient to use data from 100 people with only a few characteristics, such as age, gender, weight, heart rate, and blood pressure, to create a prediction model to identify patients at risk for lung cancer.
For these models to effectively identify patterns and risk variables linked to lung cancer, substantial amounts of data are needed. To make sure the model can generalize well across various patient populations, a few thousand patient records that cover a range of demographics, medical histories, lifestyle factors, and genetic information might be a more suitable dataset.
Example of E-commerce. Similarly, using only 20 sales transactions would not adequately represent the complexity of consumer behavior and market for an e-commerce company trying to create predictive models for price and demand forecasting.
To provide a comprehensive view that supports reliable forecasting, a dataset large enough for this situation would preferably include 100,000+ transactions, reflecting variability across different times, seasons, and promotions.
2. Quality of Data
It’s enough to have data to train a predictive analytics model. It will guarantee that the information is correct, clear, and pertinent. For example, it is considerably more advantageous to use 1,000 accurate patient records than 50,000 records, of which 70% contain mistakes, anomalies, or missing information. To avoid skewing the model’s findings, the dataset must also be representative and devoid of biases against any certain group.
Speaking about quality, processing the data is necessary to attain it, which brings us to the following phase.
C. Prepare and Process Data
Data processing and preparation are the most crucial and time-consuming steps in the AI predictive modeling process. Because of the intricate work involved, this phase may take up to 80% of the project’s total duration.
1. Data Cleaning
Eliminating mistakes and inconsistencies is the first step. This implies that we:
- Eliminate the noise
- Rectify errors
- Add average values to the missing data, remove items that are incomplete or unusual, etc.
- Poor-quality inputs cannot distort the model’s predictions when the data is cleaned.
2. Transformation of Data
The data usually has to be transformed into a format that is appropriate for the model after cleaning. We typically take the following actions at this stage.
Data normalization is the process of arranging data annotation values so that they all fall into the same range, usually between 0 and 1, so that they have an equal impact on the model.
For instance, if you’re using information on income and age:
- Ages may vary from 18 to 90 years old.
- The range of income might be between $20,000 and $200,000.
Age and income are converted to a 0–1 scale by using a technique such as Min-Max scaling. In this manner, the model can objectively evaluate each feature since no feature is given more weight than another simply because of a difference in the range of values.
Since the model can only analyze numerical data efficiently, data conversion involves converting categorical data to numerical representations.
4. Engineering Features
This is the process of choosing, altering, or producing new features from raw data using domain expertise to boost machine learning algorithms’ prediction capabilities. In essence, we evaluate the value of the current data features and determine whether new ones are required.
To find underlying linkages and assess the importance of each feature, this stage necessitates a detailed analysis of the data.
For instance, when working with patient data, we can build a new variable called Body Mass Index (BMI) in place of height and weight as distinct features.
5. Building Datasets For Testing And Training
Separating the data into distinct sets—typically 80% for training and 20% for testing and validation—is the last stage. This section enables us to precisely assess the model’s performance and train it appropriately.
D. Select A Suitable Predictive Modeling Technique
Classification In machine learning, classification merely forecasts which category or group a particular piece of data falls into. Based on the attributes that the supplied data possesses, it assigns a category (class) label.
The model is provided with the required input data as well as labels or tags that specify the category for every piece of data because classification is a supervised machine learning technique (in which a person acts as a teacher). In essence, we use the data to train the model by providing examples. Each row of data may be assigned to a particular category if the data is tabular. In this manner, the model can classify similar incoming data in the future.
- Regression: One supervised machine learning technique for identifying and learning connections between various variables in data and expressing them numerically is regression. Regression predicts some classifications that predict a label.
- Clustering: Since clustering is an unsupervised machine-learning technique, the model receives its responses without labels or a human supervisor. Using clustering, a collection of data objects can be grouped into clusters based on how similar or different their parameters are. According to specific criteria, objects in the cluster ought to resemble one another more than they should those from other clusters.
- Forecasting time series: By examining trends and patterns seen in past time-series data, time series forecasting is a technique for making predictions. This method, in contrast to all the others, is employed when analysis spanning time intervals is required.
E. Build and Train a Predictive Data Analytics Model
We use your prepared dataset to train the predictive model after we have chosen the best one. In this phase, you establish particular parameters, which are modifiable components that determine the model’s behavior.
For instance, to avoid overfitting, parameters in a healthcare model that predict the risk of lung cancer may regulate the model’s complexity or learning rate.
To increase the accuracy and effectiveness of the multimodal model, we must additionally modify these parameters. For instance, these modifications may address managing seasonal trends or adjusting to shifts in customer behavior in e-commerce systems for demand forecasting.
Additionally, when we train a predictive model, we use metrics relevant to its type to evaluate its success against the testing data.
We employ metrics like these for classification tasks:
- Accuracy evaluates the model’s overall correctness.
- The model’s recall gauges its capacity to recognize every pertinent occurrence.
- Precision measures the proportion of cases that the model accurately anticipated.
Common metrics used in regression tasks include:
- The average squared difference between the estimated and real values is determined by the Mean Squared Error or MSE.
- The model’s ability to predict unseen samples is indicated by R-squared.
These days, teams employ some kind of program, be it licensed software, open-source software, or specially designed tools, to create a predictive analytics model. Predictive modeling techniques are widely available. The most well-liked and often utilized choices are listed below:
Platforms and Tools
- TensorFlow is a machine-learning Python library that provides a variety of tools for model construction, training, and deployment.
- Another Python library that is well-known for being simple to use for implementing common machine learning algorithms is Scikit-learn.
Languages used for Programming: primarily R and Python
F. Deploy and Monitor the Model
The model is prepared for deployment to generate predictions on fresh data following a successful evaluation. When the model is deployed, it is integrated into the current environment and begins to produce insights based on real-time data. Depending on how complicated your data infrastructure is, you may need to use APIs for various integrations, which can take a long time.
Deployment is not the end, though. To make sure the model continuously works properly, ongoing monitoring is essential. We monitor its performance and make any required updates. To preserve accuracy and relevance, they could include retraining using fresh data and modifying parameters. Over time, this continuous process helps the model get better and adjust to changes.
Read Blog: What is Ensemble Modeling?
Common Predictive Modeling Challenges and Ways to Tackle Them
It would be inaccurate to claim that creating predictive models was simple. Anyone taking on this work needs to be prepared for the obstacles they will encounter. We’ve included a list of the most frequent problems along with effective fixes below.
1. Sparsity of Data
When your dataset contains a large number of zeros or “N/A” values or contains a large amount of missing or incorrect data, it is said to be data sparse.
Using average or median values from the remaining dataset to fill in the missing data is one method to deal with the issue. For instance, we could use the average age from the remaining 950 records to fill in the blanks if there are 1,000 age records and 50 are missing.
We could classify the data and determine the best values for each category for a more sophisticated strategy. It may be easier and more efficient to simply eliminate those entries if there are only a few missing values, provided that doing so does not distort the distribution of the data.
2. Selection of Features
Excessive feature counts in datasets might make modeling more difficult. Only the aspects that are most pertinent to the case might be chosen to simplify the display of the features. The significance of each characteristic can be ascertained by hand analysis or by employing models such as Random Forests or Gradient Boosting.
Principal Component Analysis (PCA) is an additional technique that reduces a big set of variables while retaining the majority of the information in the original set.
3. Interpretability
When a model’s intricacy makes it hard to comprehend how it generates its predictions, the interpretability problem could occur. Using simpler models, like Decision Trees or Linear Regression, which make it easier to grasp how input data is converted into predictions, is one technique to increase interpretability.
4. Over-fitting
When a model becomes so overfitted to the information and noise in the training data that it performs poorly on fresh data, this is known as overfitting.
This can be avoided by assessing the model’s performance on unseen data using both training and testing data. Overfitting can be lessened by modifying model features or parameters in response to the testing data’s performance.
Examples of Predictive Analytics
In practically every area, there are numerous instances of companies adopting predictive analytics to make well-informed judgments. Here are some notable examples:
1. Sports Teams: To enhance player performance, examine game plans, and scout possible additions, coaches employ predictive analytics. To forecast future player performance and guide strategy choices, they use past player statistics, player health information, and other variables.
2. Energy Sector: To better adapt production and cut waste, corporations like Chevron, Iberdrola, and others utilize predictive analytics to forecast energy demand. In addition to helping businesses increase revenues, these forecasts support environmental sustainability and energy conservation.
3. Logistics and Transportation: Predictive analytics is used by experts in both big and small logistics and transportation firms to increase fuel economy, forecast resource requirements, and optimize delivery routes. These forecasts have the potential to greatly lower operating expenses and boost the logistics sector’s productivity.
4. Agriculture: Predictive analytics tools can be used by farmers to forecast insect infestations, agricultural yields, and weather patterns. In the end, these forecasts increase crop output and lower losses by assisting farmers in making well-informed decisions regarding planting, fertilizer, irrigation, and insect control.
5. Education: Predictive analytics can be used by educational institutions such as schools to monitor student performance, forecast future success, and pinpoint areas that might require assistance. Schools can build a more effective learning environment by examining past student performance data to find trends and patterns. Although creating a predictive analytics model is a difficult undertaking, you may significantly improve the model’s performance by comprehending the procedure and selecting the best approach.

Conclusion
Whichever approach you choose hand-coding, data science tools, or a low-code Predictive GenAI platform —it should be in line with your business requirements, technological know-how, and available resources.
The benefits of using predictive analytics in business choices are significant, despite the process’s seeming complexity. The options are unlimited, whether it’s improving consumer experiences, finding new markets, optimizing processes, or maintaining an advantage over rivals.
The important thing is to get started, regardless of the approach you take to developing your predictive analytics model. A single click can start a journey of a thousand miles, and this could be the first step you take toward a future driven by data.
SoluLab helped Digital Quest improve customer engagement by developing an AI-powered chatbot tailored for travel recommendations. Using Generative AI, the chatbot delivers personalized suggestions, and reservations, and collects user feedback for continuous improvement. With multi-language support and 24/7 availability, it ensures exceptional service and global reach. SoluLab, an AI development company, can transform your business with expert solutions—contact us today!
FAQs
1. Which software is best for predictive modeling?
Excel, R, and Python are popular predictive modeling tools. Python and R excel at complicated machine learning with sci-kit-learn and caret. Excel is excellent for basic regression models but lacks scalability and automation for complex predictive analytics. Python and R excel as AI agents for procurement models and huge datasets.
2. How do I choose the right predictive model?
Data type and goal determine the option. Classification methods handle categorical data, and regression models continuous variables. Complex patterns benefit from decision trees and neural networks. Interpretability, accuracy, and computing cost influence model selection. Multi-model testing and performance measurements provide the optimal solution.
3. Can Excel be used for predictive analytics?
Excel has built-in regression analysis, trendlines, and Solver add-ins for basic predictive analytics. It struggles with large datasets and complex models. Python or R supports decision trees, neural networks, and ensemble approaches better and scales better for advanced machine learning.
4. What is the role of machine learning in predictive analytics?
Pattern identification and accuracy are improved by machine learning in predictive analytics. It analyzes massive datasets, finds hidden trends, and improves forecasts. Since it adjusts, machine learning is useful for fraud detection, customer behavior forecasting, and demand prediction. Decision trees and neural networks improve model efficiency.
5. Why is data preprocessing important in predictive modeling?
Inconsistencies, missing values, and biases are removed during data preprocessing to provide reliable predictions. Normalization, categorical variable encoding, and feature selection improve model performance. Bad data leads to misleading results, therefore pretreatment is vital for accurate analytics in creating base tokens. Proper data processing improves machine learning model efficiency and decision-making.
Shipra Garg is a tech-focused content strategist and copywriter specializing in Web3, blockchain, and artificial intelligence. She has worked with startups and enterprise teams to craft high-conversion content that bridges deep tech with business impact. Her work translates complex innovations into clear, credible, and engaging narratives that drive growth and build trust in emerging tech markets.